
In an earlier post I
explored if capturing profiling info from a low level systems engg perspective
is even remotely useful. The result was that if the tools are coperative then it
is worthwhile capturing profiling info from the computational device / element
perspective. Looking into the call graph from the framework implementation gives
a ton of context on how the framework implements Deep Learning
operators. Clearly, profiling as an aid to debugging is not a new idea (at
all). Most Deep Learning frameworks have their own rich set of profiling tools
and libraries. Refer below for sample outputs from MXNet. However, the
biggest utility of looking into such info is what it provides in addition to the
framework specific features.
MXNet Profiler Output
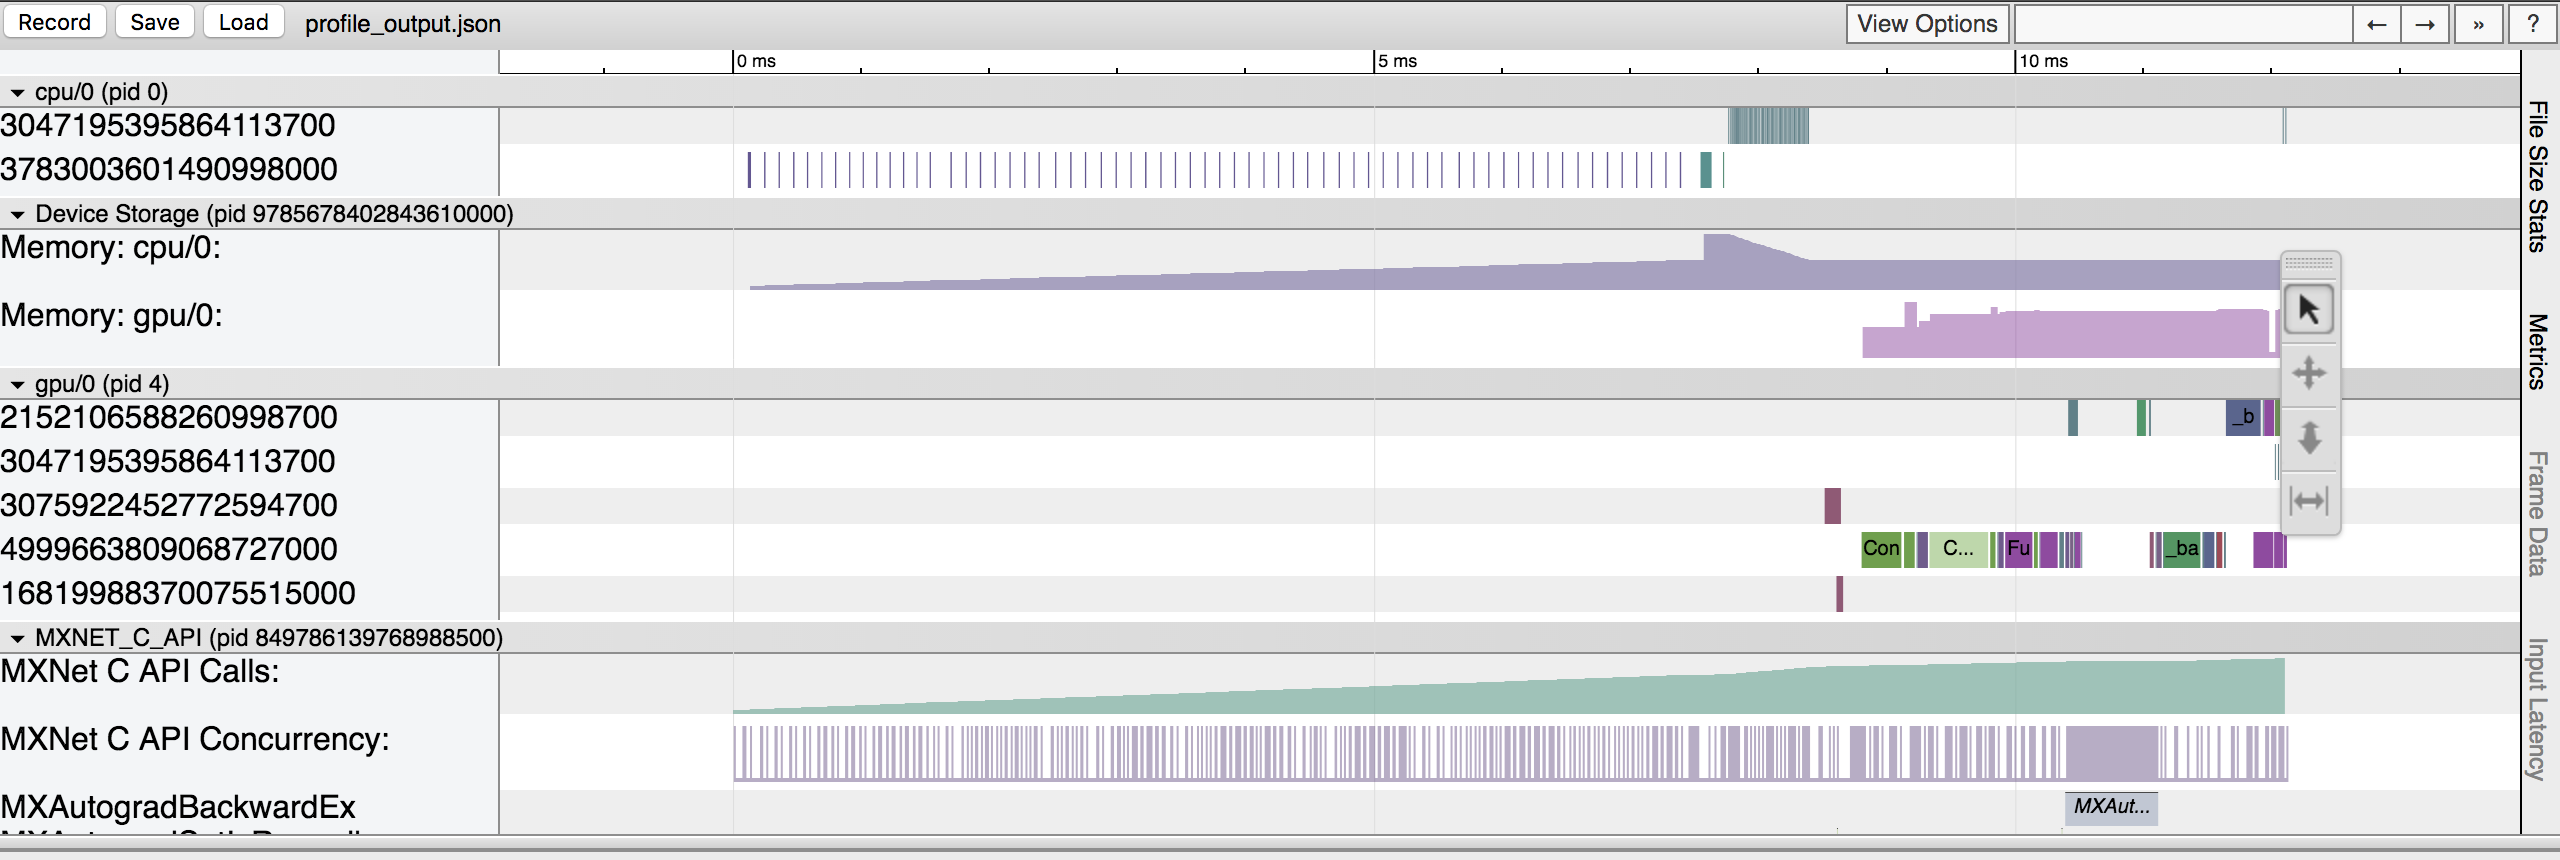
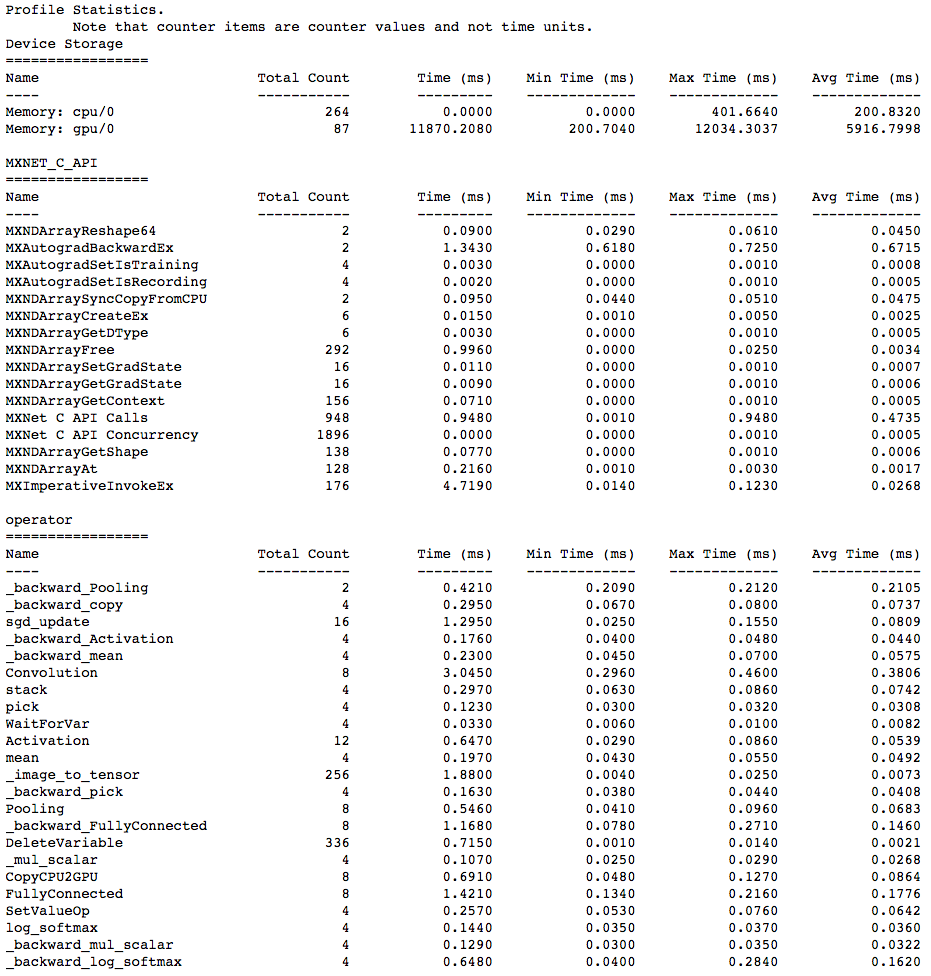
From the above output it should be clear that obtaining Operator level
information should be fairly easy if you followed steps to use the MXNet
Profiler
in your Deep Learning Model.
Is it even useful?
So, is it even useful to capture profiling info from tools like perf to
debug bugs and bottlenecks in the model itself? I found the answer is it may not
be terribly useful in obtaining contextual information or it may not help you
tune hyper parameters to make the training more effective, it does help make the
training itself a bit more efficient.
If you are curious about learning regarding the implementation of
FullyConnected Operator in MXNet it is useful to look the stack trace
and compare the run times between different implementations. MXNet offers a
bunch of options to run on ctx<gpu>() or ctx<cpu>(). Even when run on
CPU, there are couple of options you build MXNet with. It could be Intel’s
MKLDNN library (separate installation) or OpenBLAS which is the more general
open source library of Linear Algebra Programs that are optimized in software
(not hardware target based).
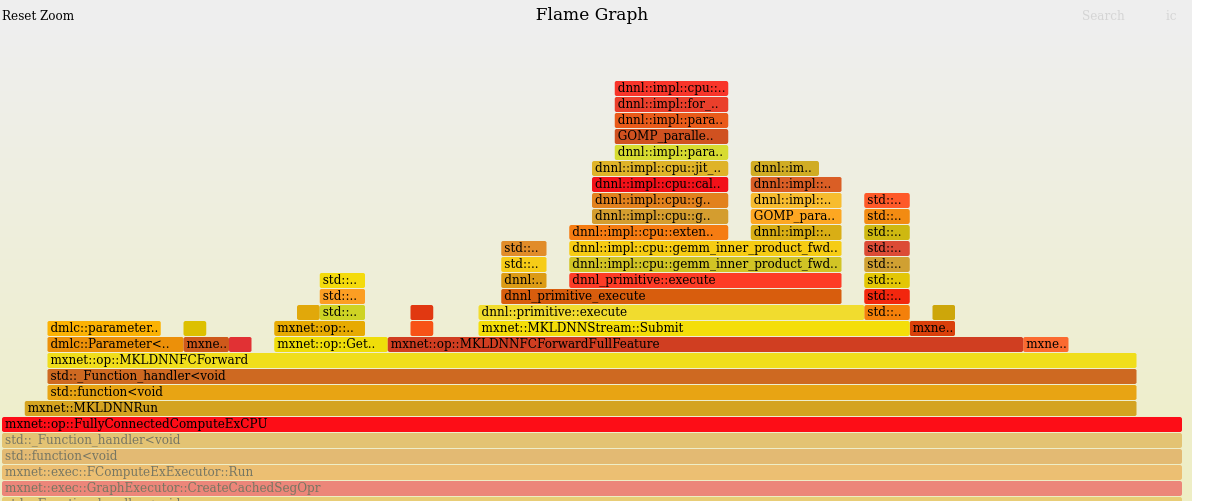 Once you reach the top of the graph below.
 you will start to see calls to
jit_avx_gemm_f32 which is a call to Intel’s Hardware that provides
acceleration for MKL or Math Kernel Library. The source code can be
found here
Bonus: Off-CPU Flamegraph for MLP

My Podcast!
If you like topics such as this then please consider subscribing to my podcast. I talk to some of the stalwarts in tech and ask them what their favorite productivity hacks are:
Available on iTunes Podcast
Visit Void Star Podcast’s page on iTunes Podcast Portal. Please Click ‘Subscribe’, leave a comment.
