
Edit:
I published this post a couple of days ago. I have figured since then the content of this post has flaws. So I am making a follow up post to this instead of simply changing this as a reminder to future self of why I went wrong here.
tl;dr:
- I didn’t understand / use the Google Benchmark correctly.
- This flaw in the logic led to a few serial errors.
- I tried to take a shorter route to benchmarking with Google
Benchmark. Specifically, I did not realize that the benchmark loops for several
thousands of iterations until confidence values are achieved.
helper_()andclear_up_()were bad shortcuts. - My original intent was muddled as I tried to quickfix “minor” errors.
Firstly, this post is a short walk through in C++ code, but feel free to
jump to the conclusion for my New Year’s Resolution (Spoiler: It’s not an “Aha!”
moment)
Finding Unique elements in you vector
So, here I was minding my business on a nice weekend. I just wanted to find the
unique elements in my vector of integers. So I started reaching for the nearest
std::set data structure. Turns out, this is likely implemented using RB
Trees according to CPP
Reference
What If … ?
I was wondering if this is in critical path of my code, then should I blindly
rely on it? So I just looked up the sample impl on wikipedia linked above. My
head spun for a few seconds to see that the impl invokes every family member for
each node including GetUncle(Node* n). This is usually a bad sign, it
smells.
So, instead of looking at the gargantuan implementation details in the STDLIB codebase, I decided to simply measure.
Setup Benchmark
So I setup a quick Google Benchmark harness:
cmake_minimum_required(VERSION 3.16)

# Compiler and Standard
set(CMAKE_C_STANDARD 99)
set(CMAKE_CXX_STANDARD 17)
set(CMAKE_C_COMPILER clang-8)
set(CMAKE_CXX_COMPILER clang++-8)

# set the project name
set(this_project project_name)

# RUST, Erlang, what else
project(${this_project} C CXX)

add_subdirectory(src)

find_package(benchmark REQUIRED)
target_link_libraries(${this_project} benchmark::benchmark)

set(CMAKE_BUILD_TYPE Release)
set(CMAKE_ENABLE_EXPORTS ON)
set(CMAKE_EXPORT_COMPILE_COMMANDS ON)
Measure the Truth
So I got the following code cranked up in no time.
Setup:
- Get a few (1000) random numbers
- Insert numbers into a set (RB Tree)
std::vector<int> nums_;
std::vector<int> nums_cp_;
auto helper_(int n) -> std::vector<int> {
    auto gen_node_ = [=]() -> int { return rand() % 100; };
    while (n--) { nums_.emplace_back(gen_node_()); }
    std::copy(nums_.begin(), nums_.end(), std::back_inserter(nums_cp_));
    return nums_;
}

auto clear_up_() -> void {
    nums_.clear();
    nums_cp_.clear();
}

static void BM_Overhead(benchmark::State& state) {
    for (auto _ : state) {
        helper_(1000);
        clear_up_();
    }
}
BENCHMARK(BM_Overhead);

static void BM_Set(benchmark::State& state) {
    for (auto _ : state) {
        helper_(1000);
        std::set<int> s;
        for (const auto& e_ : nums_) { s.insert(e_); }
        clear_up_();
    }
}
BENCHMARK(BM_Set);

BENCHMARK_MAIN();
Result:
2021-01-04 20:57:17
Running ./src/project_name
Run on (16 X 3700 MHz CPU s)
CPU Caches:
  L1 Data 32 KiB (x8)
  L1 Instruction 64 KiB (x8)
  L2 Unified 512 KiB (x8)
  L3 Unified 8192 KiB (x2)
Load Average: 0.48, 0.75, 0.79
------------------------------------------------------------
Benchmark                  Time             CPU   Iterations
------------------------------------------------------------
BM_StringCreation       32.7 ns         32.6 ns     21474767
BM_StringCopy           79.9 ns         79.9 ns      8852194
BM_Overhead      45110 ns        45102 ns        15699
BM_Set                310303 ns       310241 ns         2283
If a string copy takes under 80ns a RB Tree insertion of 1000 numbers takes
tens of thousands of times longer? My intuition was that something was not right. But it’s the
hallowed stdlib itself! You know, it comes with all that claim of:
"It's been optimized and tested over decades, so you dummies cannot outdo it in reasonable time"
To be fair, I also remember the famous:
"It's not magic, you could muck it up as easily as another language"
If there’s one skill I have built over time, it’s running into situations that could only be described as: “you are using it akk wrong, it won’t work well in this case”
I’m somewhat of an expert in this myself :D
Am I doing something wrong?
There’s only one way to find out, what if I could swap all the unique elements
to the front side of the vector and leave all the duplicates to the back?
There’s an algorithm just for this in the standard library - it’s called
std::unique()
Allegedly, one such impl of this algo is:
template <class ForwardIterator>
  ForwardIterator unique (ForwardIterator first, ForwardIterator last)
{
  if (first==last) return last;

  ForwardIterator result = first;
  while (++first != last)
  {
    if (!(*result == *first))  // or: if (!pred(*result,*first)) for version (2)
      *(++result)=*first;
  }
  return ++result;
}
Now, further if the array is already sorted then it must be very easy.
std::vector<int> nums_;
std::vector<int> nums_sorted;
std::vector<int> nums_cp_;
auto helper_(int n) -> std::vector<int> {
    auto gen_node_ = [=]() -> int { return rand() % 100; };
    while (n--) { nums_.emplace_back(gen_node_()); }
    std::copy(nums_.begin(), nums_.end(), std::back_inserter(nums_sorted));
    std::sort(nums_sorted.begin(), nums_sorted.end());
    std::copy(nums_.begin(), nums_.end(), std::back_inserter(nums_cp_));
    return nums_;
}

auto clear_up_() -> void {
    nums_.clear();
    nums_cp_.clear();
	nums_sorted.clear();
}

static void BM_Overhead(benchmark::State& state) {
    for (auto _ : state) {
        helper_(1000);
        clear_up_();
    }
}
BENCHMARK(BM_Overhead);

static void BM_Set(benchmark::State& state) {
    for (auto _ : state) {
        helper_(1000);
        std::set<int> s;
        for (const auto& e_ : nums_) { s.insert(e_); }
        clear_up_();
    }
}
BENCHMARK(BM_Set);

static void BM_UnorderedSet(benchmark::State& state) {
    for (auto _ : state) {
        helper_(1000);
        std::unordered_set<int> s;
        for (const auto& e_ : nums_) { s.insert(e_); }
        clear_up_();
    }
}
BENCHMARK(BM_UnorderedSet);

static void BM_UniqueUnSort(benchmark::State& state) {
    for (auto _ : state) {
        helper_(1000);
        auto uniq_iter = std::unique(nums_.begin(), nums_.end());
        nums_.erase(uniq_iter, nums_.end());
        clear_up_();
    }
}
BENCHMARK(BM_UniqueUnSort);

static void BM_UniqueSort(benchmark::State& state) {
    for (auto _ : state) {
        helper_(1000);
        auto uniq_iter = std::unique(nums_.begin(), nums_.end());
        nums_.erase(uniq_iter, nums_.end());
        clear_up_();
    }
}
BENCHMARK(BM_UniqueSort);

BENCHMARK_MAIN();
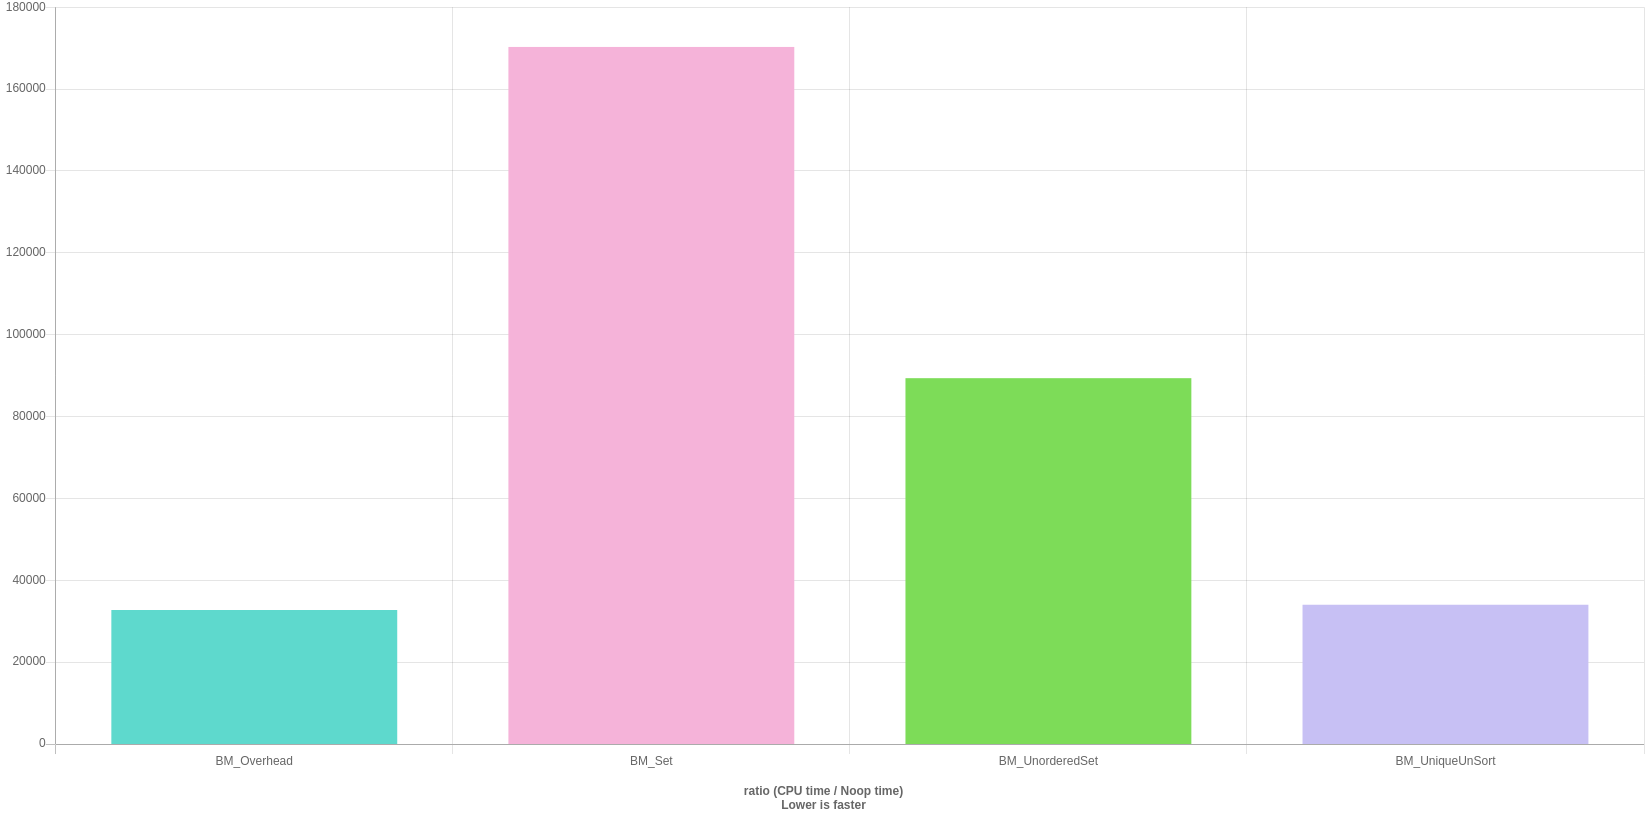
Results:
So the simple stupid algo is close to 17x faster. Further, if the array is already sorted then it’s way faster! To be fair, the sorting is a significant overhead so unless your data is already sorted simply sticking with the swapping algo gives a significant speedup.
2021-01-04 20:57:17
Running ./src/project_name
Run on (16 X 3700 MHz CPU s)
CPU Caches:
  L1 Data 32 KiB (x8)
  L1 Instruction 64 KiB (x8)
  L2 Unified 512 KiB (x8)
  L3 Unified 8192 KiB (x2)
Load Average: 0.48, 0.75, 0.79
------------------------------------------------------------
Benchmark                  Time             CPU   Iterations
------------------------------------------------------------
BM_StringCreation       32.7 ns         32.6 ns     21474767
BM_StringCopy           79.9 ns         79.9 ns      8852194
BM_Overhead      45110 ns        45102 ns        15699
BM_Set                310303 ns       310241 ns         2283
BM_UnorderedSet       146815 ns       146788 ns         4702
BM_UniqueUnSort        60466 ns        60454 ns        12010
Benchmark
- Overhead is present in all functions:
Perf Counters (For Fun):
sudo ~/bin/perf stat -e "sched:sched_process*,task:*,L1-dcache-loads,L1-dcache-load-misses,cycles,cs,faults,migrations" -d -d -d ./src/project_name
<-dcache-loads,L1-dcache-load-misses,cycles,cs,faults,migrations" -d -d -d ./src/project_name
2021-01-04 21:05:17
Running ./src/project_name
Run on (16 X 3700 MHz CPU s)
CPU Caches:
  L1 Data 32 KiB (x8)
  L1 Instruction 64 KiB (x8)
  L2 Unified 512 KiB (x8)
  L3 Unified 8192 KiB (x2)
Load Average: 0.69, 0.62, 0.68
------------------------------------------------------------
Benchmark                  Time             CPU   Iterations
------------------------------------------------------------
BM_StringCreation       31.8 ns         31.8 ns     22014537
BM_StringCopy           80.3 ns         80.2 ns      8700024
BM_Overhead      44357 ns        44334 ns        15554
BM_Set                315421 ns       315218 ns         2200
BM_UnorderedSet       151866 ns       151778 ns         4507
BM_UniqueUnSort        60268 ns        60228 ns        11901

 Performance counter stats for './src/project_name':

                 0      sched:sched_process_free
                 1      sched:sched_process_exit
                 0      sched:sched_process_wait
                 0      sched:sched_process_fork
                 1      sched:sched_process_exec
                 0      sched:sched_process_hang
                 0      task:task_newtask
                 1      task:task_rename
    30,338,551,811      L1-dcache-loads                                               (41.57%)
         2,017,065      L1-dcache-load-misses     #    0.01% of all L1-dcache hits    (41.64%)
    24,102,837,079      cycles                                                        (41.71%)
               564      cs
               146      faults
                 3      migrations
    30,422,089,436      L1-dcache-loads                                               (41.78%)
         1,842,248      L1-dcache-load-misses     #    0.01% of all L1-dcache hits    (41.85%)
   <not supported>      LLC-loads
   <not supported>      LLC-load-misses
     2,444,321,168      L1-icache-loads                                               (41.82%)
         1,575,062      L1-icache-load-misses     #    0.06% of all L1-icache hits    (41.77%)
           245,849      dTLB-loads                                                    (41.70%)
            88,316      dTLB-load-misses          #   35.92% of all dTLB cache hits   (41.64%)
            70,125      iTLB-loads                                                    (41.57%)
            11,027      iTLB-load-misses          #   15.72% of all iTLB cache hits   (41.50%)
         1,039,464      L1-dcache-prefetches                                          (41.47%)
   <not supported>      L1-dcache-prefetch-misses

       5.756089511 seconds time elapsed

       5.735565000 seconds user
       0.000000000 seconds sys
Conclusions:
- Question everything in your workload,
- Experiment for your usecase
- Have fun. Sounds like a good New Year’s Resolution anyway!
Appendix:
This generated quite a few comments on Reddit So I will try to address a few valid points that were raised.
Quick Benchmark is a nice tool!
https://quick-bench.com/q/ekKw1U0yXiRF2-dYFmr8l_8naYc
“Do not use Debug Build”
This is valid in general while measuring performance.
But in this case, my cmake is applicable only to the code I write! Remember,
you won’t be building a debug version of the standard library just because you
built your application with Debug flags. If you see the code, there’s hardly any
code that’s not from the stdlib here.
I use Debug builds for experiments because it is helpful in profiling etc.
But here, we are simply trying to illustrate that using simpler algos can be
more useful. Unless, you are profiling a piece of algo/code you have come up
with the compiler won’t affect the behavior of standard library code in any
significant way based on the flags set in your code.
Nonetheless, this is a fair point, so I have modified accordingly and shared the numbers below.
“Why use a sorted structure”
Because it makes it easier to find duplicates so you would expect the final algo
in our case Unique, to run faster.
Why set vs map?
Because intuitively you associate set as a container unique keys.
“I have a problem with the title?”
- The Question is
"What If?" - New Year’s Resolution is copied over from above:
Question everything in your workload,
Experiment for your usecase
Have fun.
Code Changes:
Thanks to many redditors for useful feedback:
u/pi_stuff, u/FutureChrome, u/shimdar, and u/lostera
My Podcast!
If you like topics such as this then please consider subscribing to my podcast. I talk to some of the stalwarts in tech and ask them what their favorite productivity hacks are:
Available on iTunes Podcast
Visit Void Star Podcast’s page on iTunes Podcast Portal. Please Click ‘Subscribe’, leave a comment.
