
In an earlier post, we looked into using systems profiler like Perf and Flamegraphs to debug bottlenecks in Deep Learning Models. While it does give us some extremely useful info. However, there is a lot of using a Profiler that’s framework aware. Such a tool an provide very specific info about critical operations and functions. Let’s look into a case for such tools.
MXNet Profiler talks plenty about how to use the MXNet profiler to debug a neural network. However, when I was working with sample C++ model for training and inference I noticed that there was no documentation to do the same. This was surprising since MXNet library is implemented in Modern C++. As far as I can tell, the Python layer is sort of a frontend to the library. It supports several languages to write the frontend in - C++, Lua, Java, Clojure etc.
Based on the profiler’s
tutorial
I knew you could generate useful traces of critical MXNet operators and
functions. Upon looking closer on how MXNet calls into the profiler in
Python I noticed something:
def set_config(**kwargs):
    """Set up the configure of profiler (only accepts keyword arguments).
	...
    """
    kk = kwargs.keys()
    vv = kwargs.values()
    check_call(_LIB.MXSetProcessProfilerConfig(len(kwargs),
                                               c_str_array([key for key in kk]),
                                               c_str_array([str(val) for val in vv]),
                                               profiler_kvstore_handle))
The check_call() above is simply dialing into the C++ implemenation of
the function which set profiler’s config in the above case. Similarly, there has
other APIss that the profiler implements which are present in the C++
land. Sure enough, there were set_state() and dump() doing the same
thing too.
C++ API for Profiler
The important C++ counterparts to the ones mentioned in the tutorial are as follows. In fact, there are the same backend functions implementing the profiler functionality as the Python APIs.
    MXSetProfilerConfig();
    MXSetProfilerState();
    MXSetProfilerState();
    MXDumpProfile();
Show Me The Code
The profiler takes a few parameters and these params are accepted as a map whose keys are the names of the params passed to the Profiler along with their values.
    const char *keys[4] = {
			   "profile_all",
			   "aggregate_stats",
			   "continuous_dump",
			   "filename",
    };
    const char *vals[4] = {
			  "True",
			  "True",
			  "True",
			  "profile_output.json",
    };
    int on = 1;
Below is the code for configuring the profiler and setting it’s state to on
when it starts collecting the input for generating the trace output.
    MXSetProfilerConfig(4, keys, vals);
    MXSetProfilerState(on);
    auto train_iter =  MXDataIter("MNISTIter");
    if (!setDataIter(&train_iter, "Train", data_files, batch_size)) {
	return 1;
    }

    auto val_iter = MXDataIter("MNISTIter");
    if (!setDataIter(&val_iter, "Label", data_files, batch_size)) {
	return 1;
    }

    TRY
	auto net = mlp(layers);

    Context ctx = Context::cpu();  // Use CPU for training

	// ... rest follows

    MXSetProfilerState(!on);
    MXDumpProfile(on);

    delete exec;
    delete opt;
    MXNotifyShutdown();

	// ... end
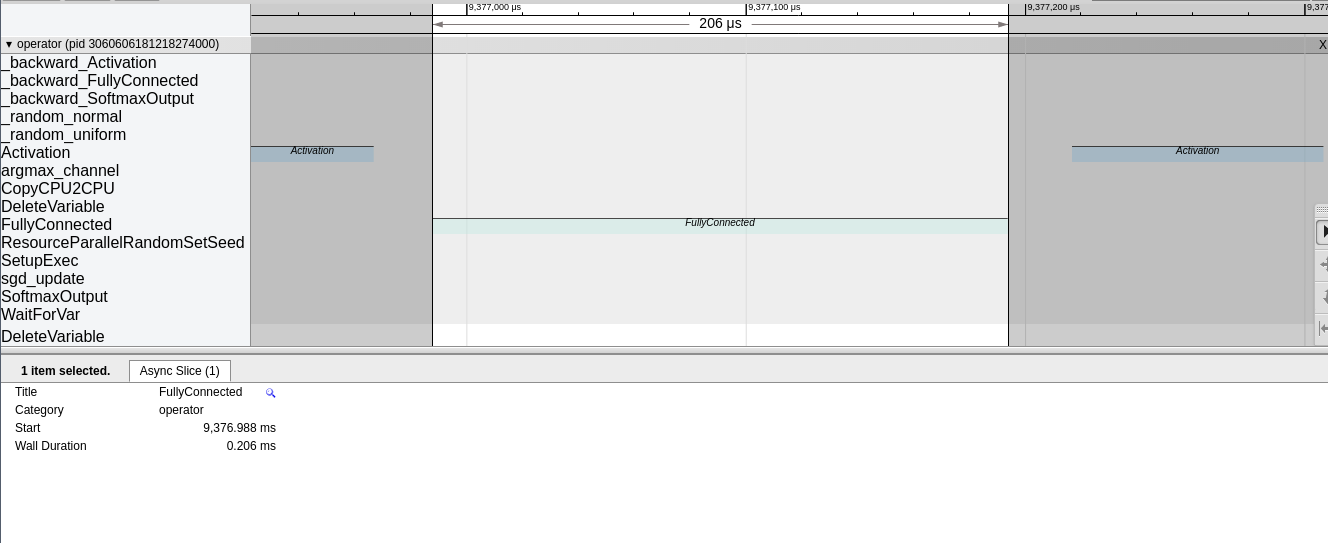
After dumping the output via MXDumpProfile() we get a JSON file which
can be viewed in a Chrome browser with chrome://tracing
Demo
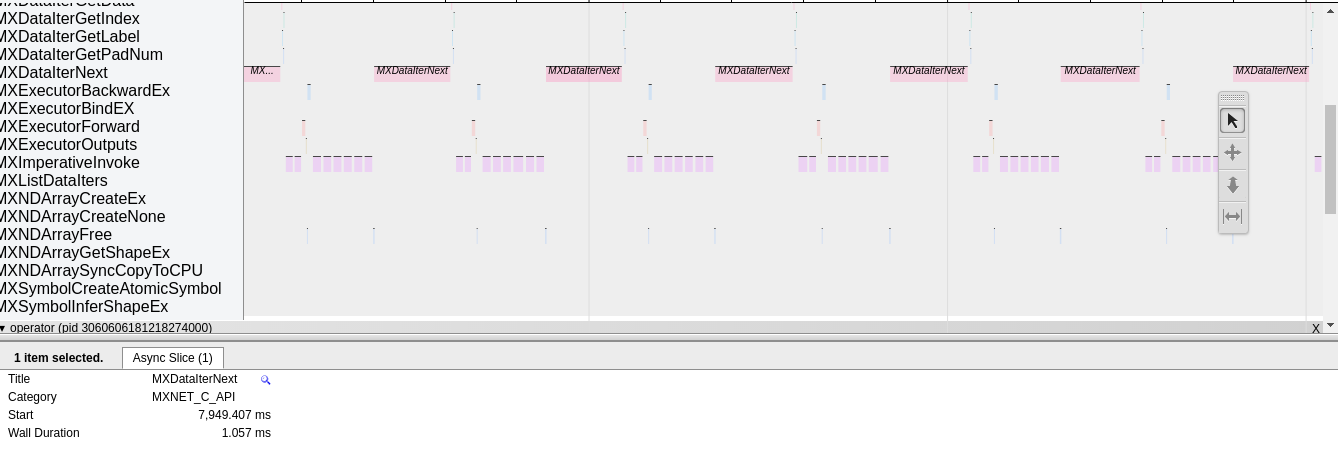
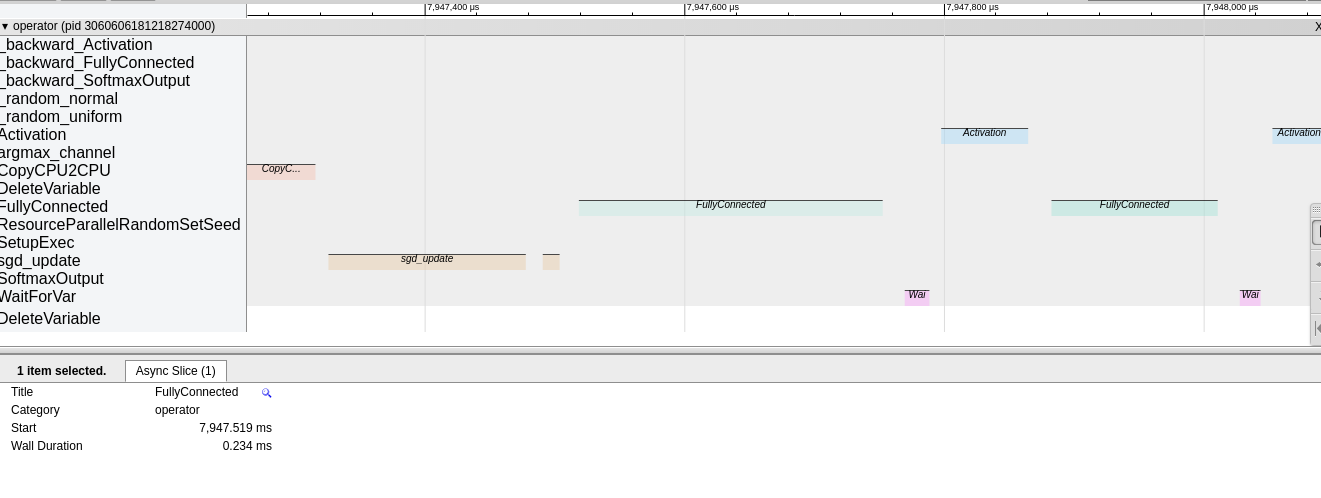
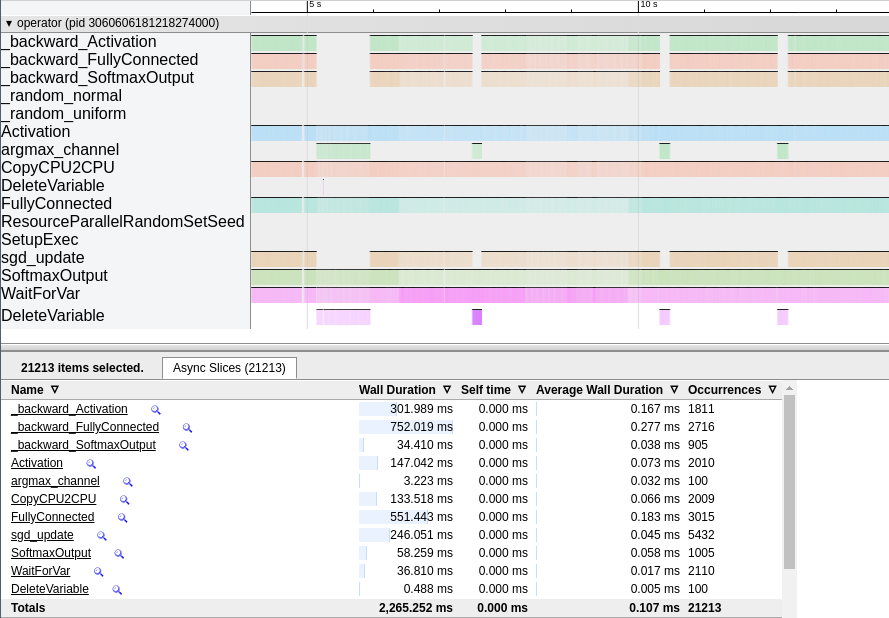
Well the output is trace of the neural network as show below which can be traced like any other Chrome trace output.
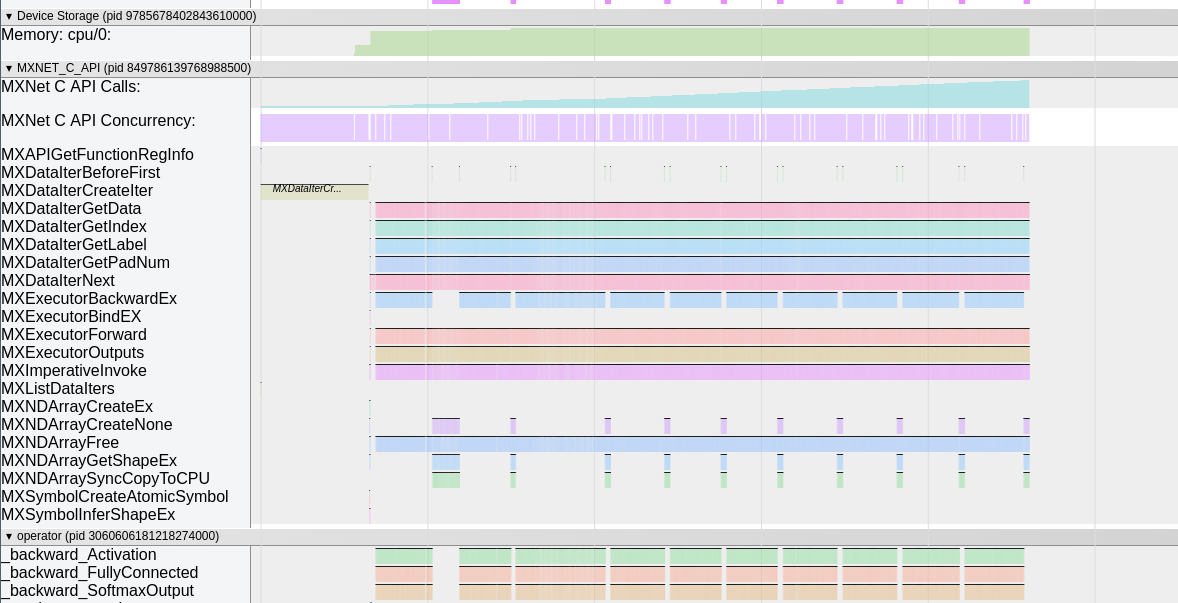
API Info
Operator Info
Stats In Selection
Focus Selection
My Podcast!
If you like topics such as this then please consider subscribing to my podcast. I talk to some of the stalwarts in tech and ask them what their favorite productivity hacks are:
Available on iTunes Podcast
Visit Void Star Podcast’s page on iTunes Podcast Portal. Please Click ‘Subscribe’, leave a comment.
