
In an earlier post, we have
looked at using modern C++ semantics to synchronize threads. I mentioned that
the future objects are instantiated in one of the following ways:
    async
    promise::get_future
    packaged_task::get_future
Today, let’s look into the first way a little more. If you are familiar with
future and async() method, I recommend that you jump below to the
Run section where we capture from
ftrace events and
perf events to see if we can catch anything.
async() from future
Basically, the async() method provides a mechanism to call the provided
function asynchronously. It does in two flavors:
Asynchronous
Launches a new thread to call the given function and returns a future
object. Accessing the shared state of this future object joins the
thread.
// *try* and flush the caches
my_mem_flush(stack_start, flush_size);

// ...

for ([[maybe_unused]] auto i : {1, 2, 3, 4, 5}) {
	// policy for async() is unspecified
	std::future<bool> fut = std::async(prime_lambda, prime_candidate);
	auto f =
		[&ret, &fut]() -> bool {
			// gets the result from the future
			// if this accesses the shared state here
			// then this is the equivalent of calling "deferred"
			ret = fut.get();
			return ret;
		};
	total += timed_lambda(f, "unspecified");
}
// print avg of times here
Deferred
Calls the provided function at some point returning without waiting for the
execution of the function to complete. The value returned by the function can be
accessed through the future object retuned by the async() call by calling
it’s member get().
The function temporarily stores in the shared state either the threading handler used or decay copies of provided function and its args (as a deferred function) without making it ready. Once the execution of provided function is completed, the shared state contains the value returned by provided function and is made ready.
std::future<bool> def_fut = std::async(launch::deferred,
					prime_lambda, prime_candidate);

// ... Lot of things can happen here with no concurrent computation on going

// *try* and flush the cache to get unbiased perf numbers
auto foo_cache_flush = [&stack_start, &flush_size]() {
			my_mem_flush(stack_start, flush_size);
			};

// explained shortly ...
timed_lambda(foo_cache_flush, "cacheflush");

auto foo_deferred_fut_get = [&ret, &def_fut]() {
				ret = def_fut.get();
				};
auto tt = timed_lambda(foo_deferred_fut_get, "deferred");
std::cout << "deferred took " << tt << "us on avg" << std::endl;
What is the task function?
The obvious question is what is the actual workload function of the created thread? In the above code, to appease the impatient reader with the semantics of the core of this article I waited until now. it so the meaning is obvious. The function is to determine the primality of some number. We select a large prime number and purposely write the prime checker to be inefficient.
auto prime_candidate = 313222313;

// purposely slow primality lambda
auto prime_lambda = [](auto x) {
			std::cerr << "Wait ..." << x << std::endl;
			for (int i = 2; i < x; ++i) if ((x % i) == 0) return false;
			return true;
		};
Lambda to measure time taken
If not for anything else, I want to record my lambda to simply measure the time taken by a given piece of execution (this could be a Lambda too!).
auto timed_lambda = [](auto lam, auto mod_name) -> long {
			auto before = std::chrono::steady_clock::now();
			lam();
			auto after = std::chrono::steady_clock::now();

			// pretty prints the time take and the module name
			auto t = print_ts(string(mod_name), before, after);
			return t;
		};
Flush Cache
I tried to flush cache for unbiased perf counter measurements and my (poor) attempt at doing so is:
void my_mem_flush(const void *p, unsigned int allocation_size){
    const size_t cache_line = 64;
    const char *cp = (const char *)p;
    size_t i = 0;

    if (p == NULL || allocation_size <= 0)
        return;

    for (i = 0; i < allocation_size; i += cache_line) {
        asm volatile("clflush (%0)\n\t"
                :
                : "r"(&cp[i])
                : "memory");
    }

    asm volatile("sfence\n\t"
                 :
                 :
                 : "memory");
}
Build
The commands used for building:
clang++ -fno-omit-frame-pointer -o mfa ./my_future_async.cpp -lpthread
Run
There’s some magic here showing the nuances of how to efficiently measure the performance of your program.
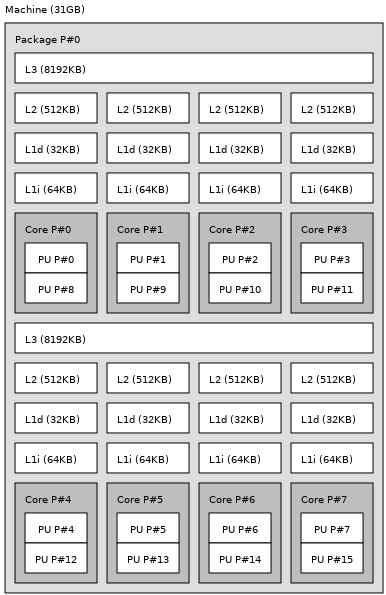
Before we go deep into the weeds with perf numbers, here’s the topology of my
processor:
Here, I’m capturing the following stats, if you are interested in more such captures visit: here and here
sudo perf stat -e "sched:sched_process*,task:*,L1-dcache-loads,L1-dcache-load-misses,cycles" -d -d -d ./mfa 2
Perf Results for Deferred async() Call
===========================
deferred: ran for 1062014us
===========================
deferred: ran for 1058999us
===========================
deferred: ran for 1064882us
===========================
deferred: ran for 1062698us
===========================
deferred: ran for 1074213us
===========================
It is prime!

 Performance counter stats for './mfa 2' (5 runs):

                 0      sched:sched_process_free
                 1      sched:sched_process_exit
                 0      sched:sched_process_wait
                 0      sched:sched_process_fork
                 1      sched:sched_process_exec
                 0      sched:sched_process_hang
                 0      task:task_newtask
                 1      task:task_rename
     1,889,395,127      L1-dcache-loads                                               ( +-  0.18% )  (49.75%)
           118,073      L1-dcache-load-misses     #    0.01% of all L1-dcache hits    ( +-  3.07% )  (50.09%)
     4,560,776,662      cycles                                                        ( +-  0.08% )  (50.30%)
     1,875,712,171      L1-dcache-loads                                               ( +-  0.03% )  (50.37%)
           127,164      L1-dcache-load-misses     #    0.01% of all L1-dcache hits    ( +-  2.04% )  (50.44%)
   <not supported>      LLC-loads
   <not supported>      LLC-load-misses
         2,107,388      L1-icache-loads                                               ( +-  2.19% )  (50.46%)
            85,975      L1-icache-load-misses     #    4.08% of all L1-icache hits    ( +-  3.68% )  (50.25%)
             5,150      dTLB-loads                                                    ( +- 16.93% )  (49.91%)
               800      dTLB-load-misses          #   15.53% of all dTLB cache hits   ( +- 35.91% )  (49.70%)
               114      iTLB-loads                                                    ( +- 45.37% )  (49.63%)
                65      iTLB-load-misses          #   57.57% of all iTLB cache hits   ( +- 68.39% )  (49.56%)
            17,289      L1-dcache-prefetches                                          ( +-  6.06% )  (49.54%)
   <not supported>      L1-dcache-prefetch-misses

           1.06622 +- 0.00258 seconds time elapsed  ( +-  0.24% )
Perf Results for Unspecified async() Call
===========================
unspecified: ran for 1061725us
===========================
unspecified: ran for 1062709us
===========================
nspecified: ran for 1059767us
===========================
unspecified: ran for 1062675us
===========================
unspecified: ran for 1064872us
===========================
It is prime!

 Performance counter stats for './mfa' (5 runs):

                 0      sched:sched_process_free
                 2      sched:sched_process_exit
                 0      sched:sched_process_wait
                 1      sched:sched_process_fork
                 1      sched:sched_process_exec
                 0      sched:sched_process_hang
                 1      task:task_newtask
                 1      task:task_rename
     1,891,466,777      L1-dcache-loads                                               ( +-  0.07% )  (49.88%)
           207,342      L1-dcache-load-misses     #    0.01% of all L1-dcache hits    ( +-  1.42% )  (50.23%)
     4,566,644,075      cycles                                                        ( +-  0.05% )  (50.37%)
     1,877,795,438      L1-dcache-loads                                               ( +-  0.08% )  (50.37%)
           210,596      L1-dcache-load-misses     #    0.01% of all L1-dcache hits    ( +-  1.43% )  (50.37%)
   <not supported>      LLC-loads
   <not supported>      LLC-load-misses
         2,345,631      L1-icache-loads                                               ( +-  1.36% )  (50.37%)
            78,357      L1-icache-load-misses     #    3.34% of all L1-icache hits    ( +-  1.64% )  (50.12%)
             5,118      dTLB-loads                                                    ( +- 12.31% )  (49.77%)
               863      dTLB-load-misses          #   16.87% of all dTLB cache hits   ( +- 19.21% )  (49.63%)
                74      iTLB-loads                                                    ( +- 33.96% )  (49.63%)
                39      iTLB-load-misses          #   53.12% of all iTLB cache hits   ( +- 44.41% )  (49.63%)
            19,378      L1-dcache-prefetches                                          ( +-  4.27% )  (49.63%)
   <not supported>      L1-dcache-prefetch-misses

          1.064263 +- 0.000823 seconds time elapsed  ( +-  0.08% )
Conclusion
The above two runs show a substantial difference in the L1 Data Cache Miss
Rates (approx 6% miss rates in L1 with async unspecified vs 11% miss rates
with async deferred), this is inline with our expectation that a deferred execution allows
for other processes and data items to be brought in to the L1 Data
Cache. Therefore, asynchronous execution trigger in a separate thread tends to
benefit from spatial and temporal locality of memory. What’s interessting is to
see the difference in the number of fork and exit counts within the
profiled time window.
Refer for typical memory heirarchy: 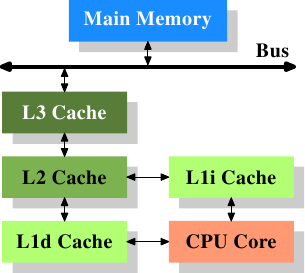
For a detailed description about Memory Hierarchy and how it affects your application’s performance I receommend slow reading this
In all, the intuition behind using deferred execution can spread out the system load slightly better and allow the application to control the trigger of the execution, however, if the impetus is to cache the results for multiple concurrent fetches (of the result) at a later point, say, something like the result of an expensive operation that you would like to have handy at the time of request, deferred launch for non-blocking applications will serve the purpose, especially such differences in perf can accumulate over time.
My Podcast!
If you like topics such as this then please consider subscribing to my podcast. I talk to some of the stalwarts in tech and ask them what their favorite productivity hacks are:
Available on iTunes Podcast
Visit Void Star Podcast’s page on iTunes Podcast Portal. Please Click ‘Subscribe’, leave a comment.
