
In earlier posts we explored impacts of concurrency on performance of C++ applications through observation of indicators like Cache Hits, Branch Prediction Rates. In this post, I simply want to explore the impact of task migration and what we can glean from various Performance Counters.
We will achieve this by, first, exploring the hardware concurrency supported by the system. Then we request the Scheduler in Linux Kernel to assign an affinity to our thread which are launched in an asynchronous fashion.
Our workload is arbitrarily chosen. It is to create an array of random numbers and sort them. Let’s walk through some code.
Selecting Cores To Migrate To:
The number of Hardware Threads of Execution available in your system is given by:
auto num_hw_threads = std::thread::hardware_concurrency();
Selecting our next destination to fly to is as simple as:
auto r_cpu = rand() % num_hw_threads;
Request CPU Affinity with Scheduler
Requesting the Scheduler in Linux Kernel to set CPU affinity has to happen via
raw system calls. Although C++ is mostly regarded as “native” language
since it generates instructions to run on target hardware, the language does
not provide a C++ way to make system calls (at least, not that I’m aware
of). This feels like a bit of a sacrilege here, but leaves us with no option
but to call raw system calls.
CPU_SET() is the place where we jot down the CPU core (or a set of them)
that you want to set the affinity to. This is helpful with allocating compute
resources to a set of tasks, typically, done in embedded devices.
bool to_core_jump_and_check(unsigned core)
{
    // initialize
    cpu_set_t set;
    CPU_ZERO(&set);

    // this is where we are writing down
    // CPU Core number to be affined to
    CPU_SET(core, &set);

    // TODO gettid() should have worked
    // somehow doesn't find this decl
    // not important, make a syscall directly
    // auto tid = gettid();
    #ifdef SYS_gettid
    pid_t tid = syscall(SYS_gettid);
    #else
    #error "SYS_gettid unavailable on this system"
    #endif

    // makes the system call requesting to set CPU
    // affinity
    if (sched_setaffinity(tid, sizeof(set), &set) == -1) {
        std::cout << "set affinity error" << std::endl;
        return false;
    } else {
        // success
        std::cerr << "thread # " << tid << " on " <<
            sched_getcpu() << std::endl;
        return true;
    }
}
Asynchronous Threads to Migrate
Here’s where we launch the threads asynchronously, notice std::launch::async
argument to std::async() call. Here we simply ask the system to launch an
asynchronous thread which, in turn, requests to be assigned to the core of
choice (random, from earlier).
std::reverse(arr.begin(), arr.end());
Then it goes on to perform some heavy-ish task on the core before retiring. This workload effectively tests the low level caches. We are generating 10000 random numbers once and sorting them each thread and then reversing them for the next async thread to sort.
std::future<bool> jump_fut = std::async(
    std::launch::async,
    [&arr, &r_cpu] (auto mod_name) {
        auto before = std::chrono::steady_clock::now();

        // request the scheduler by setting affinity
        // some times the request can fail, so it's good
        // to check if we succeeded
        auto res = to_core_jump_and_check(r_cpu);
        if (!res) return res;

        // in this case, sort the array
        do_strange_work(arr);

        auto after = std::chrono::steady_clock::now();

        // pretty print time taken
        auto t = print_ts(string(mod_name), before, after);
        return res;
    }, string("foo")
    );
Build and Run:
Build with:
clang++-8 --std=c++2a -fno-omit-frame-pointer -o mtm my_thread_migration.cpp -lpthread
Run with:
sudo perf stat -e "sched:sched_process*,task:*,L1-dcache-loads,L1-dcache-load-misses,cycles,cs,faults,migrations" -d -d -d ./mtm 1000
FlameGraphs

Only 72% approx is spent on task at hand. 28% overhead is accounted for
by cloning address spaces for over 16% of the time, refer to Async vs
Deferred for more on
this. About 7% on reversing the array and other “async” related work. 2%
on doing IO for printing logs to console.
My Machine Topology
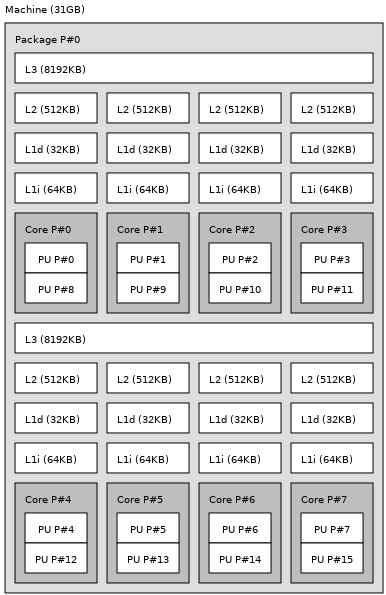
I am running this workload on a machine with 16 hardware threads, 32kB of L1
Cache, 512kB of L2 Cache, and 8MB of L3 Cache.
Task Migration Stats Overview:
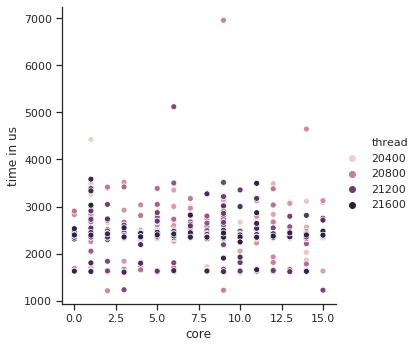
Overall Performance Statistics:
Performance counter stats for ‘./mtm 1000’
               41      sched:sched_process_free
             1,000      sched:sched_process_exit
                 0      sched:sched_process_wait
               999      sched:sched_process_fork
                 1      sched:sched_process_exec
                 0      sched:sched_process_hang
               999      task:task_newtask
                 1      task:task_rename
     8,377,208,674      L1-dcache-loads                                               (52.77%)
        54,927,050      L1-dcache-load-misses     #    0.66% of all L1-dcache hits    (53.04%)
     6,171,793,358      cycles                                                        (49.86%)
             2,335      cs
               155      faults
             1,012      migrations
     8,378,717,353      L1-dcache-loads                                               (44.83%)
        53,613,352      L1-dcache-load-misses     #    0.64% of all L1-dcache hits    (42.18%)
   <not supported>      LLC-loads
   <not supported>      LLC-load-misses
     1,234,849,730      L1-icache-loads                                               (43.26%)
         9,516,551      L1-icache-load-misses     #    0.77% of all L1-icache hits    (47.23%)
         1,317,216      dTLB-loads                                                    (46.96%)
           296,860      dTLB-load-misses          #   22.54% of all dTLB cache hits   (50.14%)
           125,811      iTLB-loads                                                    (55.17%)
            78,526      iTLB-load-misses          #   62.42% of all iTLB cache hits   (57.82%)
        41,721,058      L1-dcache-prefetches                                          (56.74%)
   <not supported>      L1-dcache-prefetch-misses

       2.795329486 seconds time elapsed

       2.505386000 seconds user
       0.288475000 seconds sys
Conclusion
Although Task Migration can be bad in terms of the overhead added for the task to resume execution on another core, this downside/loss in efficiency can be small when comapred to the delays caused by Cache Misses. Hardware Concurrency does not always mean you should take a loss on the spatial and temporal locality side of things. Hardware Concurrency does imply that you can run separate threads of execution while benefiting from cached data Hits.
These posts are purposely kept short, I try to give as much info within the
window as possible. I'm happy that folks care enough to leave comments
but I request you that more specific your feedback is, more helpful
it will be. As always, thanks for reading.
My Podcast!
If you like topics such as this then please consider subscribing to my podcast. I talk to some of the stalwarts in tech and ask them what their favorite productivity hacks are:
Available on iTunes Podcast
Visit Void Star Podcast’s page on iTunes Podcast Portal. Please Click ‘Subscribe’, leave a comment.
