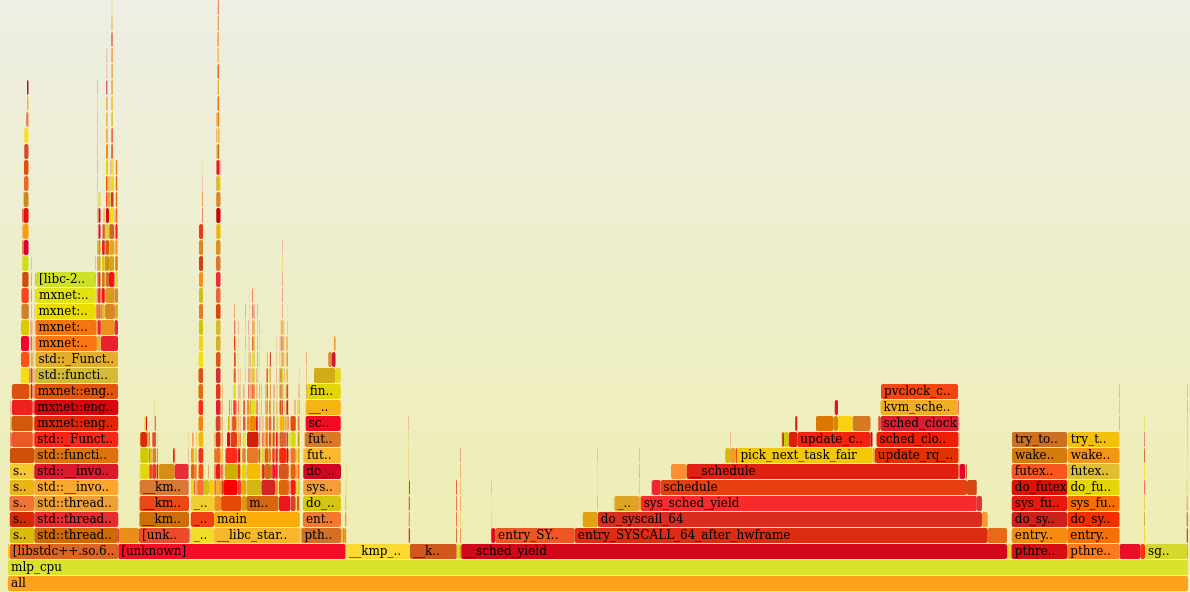
In a few earlier posts, we have seen how system profiler tools can give us a very useful insight into the deep learning program workloads akin to the traditional software.
For a usecase I started to implement a version of the Variational AutoEncoders such as this paper
So I started to implement a version of it. In the mean time, I found an existing
version of a basic VAE in
C++
implemented with libtorch
I wanted to try and get a closer look at what was happening during each epoch. I wanted the entire gravy not just the high level details, after all if I must deploy this then I would like to understand it completely.
Note: false thumbnail, click for the actual graphs
As you can see, imagine my disappointment that most time even with CPU version was spent running HW accelerated code which cannot be profiled here. I won’t bother with off-CPU graphs here. This is what allows efficient execution for OMP (and of course, CUDA offloading has more code which interfaces between CPU and GPU). Nonetheless, no real workload can be traced here.
Next Step: Build libtorchwith symbols … ugh
My Podcast!
If you like topics such as this then please consider subscribing to my podcast. I talk to some of the stalwarts in tech and ask them what their favorite productivity hacks are:
Available on iTunes Podcast
Visit Void Star Podcast’s page on iTunes Podcast Portal. Please Click ‘Subscribe’, leave a comment.


